Improving energy efficiency is an essential part of a forward-looking urban planning. To identify energy losses and potential for improvements, cities need suitable data on the existing building stock. Currently the relevant data are scattered among various different institutions; quality, degree of up-to-dateness and spatial resolution vary. In the HOTSPOTS project new technologies and methods were developed in order to analyse the current state of the existing building stock in an entire district as regards energy efficiency and microclimate. The project was carried out by researchers at Siemens’ Graz branch in collaboration with the Austrian Institute of Technology, AEE INTEC and the municipal utility company in Gleisdorf.
With the aid of new technologies to collect data on energy losses and air quality, and to process them digitally, cities should be provided with the necessary basis for planning modernization and renovation projects effectively. Urban planners thus obtain a tool with which to compute the effects of various different improvement measures and to select suitable steps to be taken in their city’s problem zones.
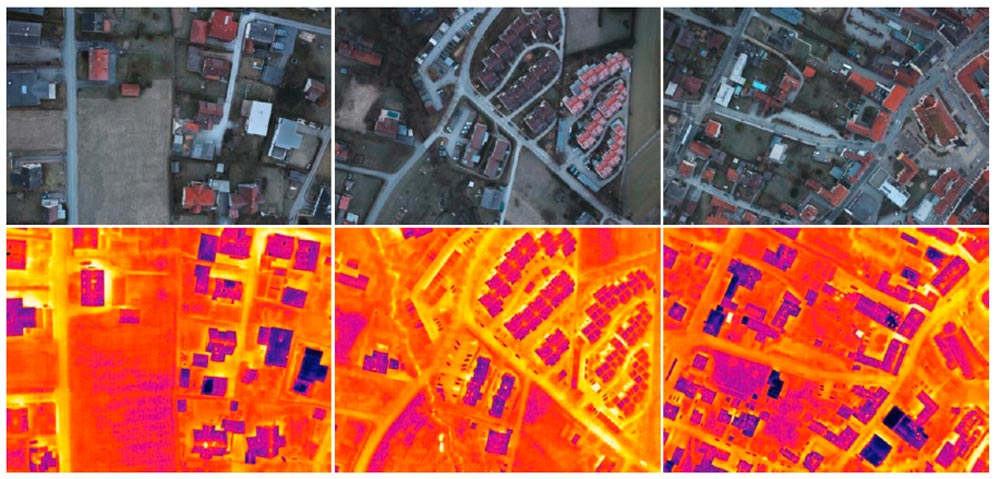
3D aerial photographs reveal energy losses and air quality
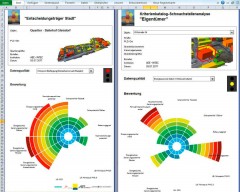
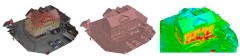
Up to now energy and heat losses from individual buildings have been viewed in isolation. With the new methods small urban districts can be reconstructed in three dimensions and cross-linked to thermal data. The data basis for the project is a 3D thermal register generated from aerial photographs. The aim here is to collect thermal data covering the whole city area. Low-level aerial photographs are taken with drones or hot-air balloons equipped with thermographic cameras and special sensors; then the data from the individual photographs are interlinked to form a holistic database. From the photographic data 3D building models can be derived, making the energy losses in a given district visible. In this way buildings or groups of buildings with exceptional potential for energy-related improvement – so-called “critical spots” – can be identified.
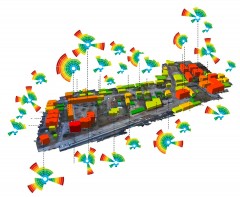
In Gleisdorf, a small town in Styria, the method was tested for the first time in 2015, and a whole district investigated from the air. As part of the project a three-dimensional model of atmospheric layers was set up, to provide information on air quality and possible causes of air pollution in the neighbourhood in question. Specially equipped drones were employed to collect data. The data obtained with the new methods form the basis for analysing local trouble spots systematically, and make it possible to identify and locate suitable energy-efficient measures.

„The consortium line-up was ideal for implementing the project. With Siemens‘ know-how in recording technology, 3D reconstruction and visual data analysis, AIT‘s expertise in data modelling in energy/urban contexts and AEE INTEC‘s technological competence and experience in cataloguing weaknesses and efficiency-boosting measures, a pioneering, practical process chain was successfully developed. Benefits for communities, utility companies and property owners were demonstrated on the spot in the town of Gleisdorf.“
Claudia Windisch
Project Leader HOTSPOTS, Siemens AG Österreich
Smart City Sensing
In a follow-on project now being carried out by AEE INTEC together with the South China University of Technology, four to eight inner-city hotspots are being investigated and analysed by means of the new methods, in Austria and the Chinese province of Guangdong. The investigations are focussed on urban heat-island effects and on identifying very local concentrations of pollutants. Air and surface temperature data and air quality data in atmospheric layers are used to model microclimate and air quality in three dimensions. It should also be possible to apply the new methods to other cities of differing size in Austria and China.
www.aee-intec.at/smacise-smart-city-sensing-n-thermal-screening-of-physical-objects-and-air-quality-at-urban-scale-p230
All pictures from the final report of the project HOTSPOTS:
https://nachhaltigwirtschaften.at/resources/sdz_pdf/schriftenreihe_2017-48-hotspots.pdf